
Seven Bridges Cancer Genomics Cloud Workshop on MCMICRO
Introduction
Welcome to the Seven Bridges tutorial on MCMICRO. Here, we will explore the integration of genomics and digital pathology through spatial biology technology. This tutorial will cover the following topics:
1. Overview of digital pathology and spatial genomics
2. Learning about the MCMICRO pipeline
3. Step-by-step guide to running the MCMICRO pipeline on the Cancer Genomics Cloud (CGC)
1. Overview of Digital
Pathology and Spatial Genomics
Digital pathology involves the acquisition, management, and interpretation of pathology information in a digital environment. This technology converts glass slides into high-resolution digital images that can be viewed, analyzed, and shared electronically.
Key Benefits:
· Enhanced Analysis: Digital pathology allows for advanced image analysis techniques, including machine learning and artificial intelligence, to identify patterns and anomalies that may not be visible through traditional microscopy.
· Remote Collaboration: Pathologists can share digital slides with colleagues around the world, facilitating remote consultations and collaborative research.
· Data Integration: Digital pathology integrates with other biomedical data sources, such as genomic data, to provide a comprehensive view of patient health.
Applications in Biomedical Research:
· Cancer Research: Digital pathology is extensively used in cancer research to analyze tumor samples, identify biomarkers, and study tumor microenvironments.
· Drug Development: It aids in the evaluation of tissue responses to new drugs, helping to accelerate the drug development process.
· Personalized Medicine: By combining digital pathology with genomic data, researchers can develop personalized treatment plans based on the specific characteristics of a patient's disease.
Spatial genomics is a cutting-edge field that combines genomic and spatial information to study the organization and function of cells within their native tissue context. This approach preserves the spatial relationships between cells while providing detailed gene expression data.
Key Benefits:
· Structural Preservation: Spatial genomics maintains the structural integrity of tissues, allowing researchers to study the spatial arrangement of cells and their interactions.
· Single-Cell Resolution: It provides high-resolution data at the single-cell level, enabling the identification of cellular heterogeneity and rare cell populations.
· Comprehensive Analysis: By integrating spatial and genomic data, researchers can gain insights into the molecular mechanisms underlying tissue function and disease.
Applications in Biomedical Research:
· Developmental Biology: Spatial genomics helps in understanding the spatial organization of cells during development and how gene expression patterns change over time.
· Neuroscience: It is used to map the spatial distribution of neurons and other cell types in the brain, providing insights into brain function and disorders.
· Cancer Research: Spatial genomics allows for the study of tumor heterogeneity, the tumor microenvironment, and the spatial distribution of immune cells within tumors.
In short, digital pathology and
spatial genomics are revolutionizing biomedical research by providing powerful
tools for the analysis of tissue samples. These technologies enable researchers
to gain a deeper understanding of disease mechanisms, develop personalized
treatments, and accelerate the discovery of new therapies. By integrating
digital pathology and spatial genomics, researchers can achieve a comprehensive
view of tissue architecture and gene expression, paving the way for
advancements in precision medicine.
2. Introduction to MCMICRO Pipeline
What is MCMICRO?
A scalable, modular imaging process pipeline for multiplex tissue imaging.
What is it used for?
Transforming whole slide images into single-cell resolution data about gene or
protein expression.
How does it work?
The pipeline consists of many components including illumination
correction, alignment and stitching, image segmentation, quantification, and
clustering.
Understanding the pipeline

In the case of histopathology, the raw data are in the form of tiles from the whole slide image, often in OME TIFF format. While MCMICRO supports OME.TIFF format, it should be noted that many other formats are also accepted: Supported Formats — Bio-Formats 8.0.1 documentation.
The very first step is illumination correction using the software BaSiC. This corrects for the fact that sometimes the image captures don’t always have the same level of light across all tiles – this normalizes the brightness.
Can you imagine why fixing the brightness might
matter?
The brightness matters because it’s going to be a controlling variable for the
INTENSITY of fluorescence, which measures the intensity of expression. We need
for all the patches of the slide, all the tiles, to have the same relative
brightness baseline so we can compare expression.
The second stage is alignment and stitching. This is done with the software ASHLAR. Alignment is also called registration. Each channel is a separate image capture, saved as a layer of the image, and so the layers must be aligned to make sure that they overlap correctly. Additionally, the tiles need to be stitched together.


There’s an optional step right after alignment called “TMA
Core Detection”, or “dearraying”, that uses the software Coreograph.
This is only used if the slide that you’re processing is a Tissue Micro Array
instead of a Whole Slide Image. A tissue microarray (TMA) lets you put tiny
core samples of multiple tissues onto one slide and image them simultaneously.
Coreograph identifies the tissue cores and separates them out into stitched
whole images of each core, so that they can be analyzed separately but in
parallel.


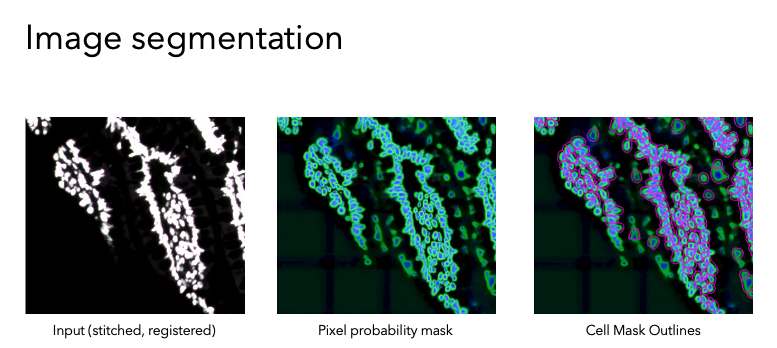
The next step is Image Segmentation, which is done in two different ways. Segmentation means annotating the images to outline discrete parts of them—in this case, cell membrane outlines and nuclei. Image Segmentation is done by applying machine learning models. The examples given here are UnMICST software and S3segmenter software, but MCMICRO on the CGC can use a few other algorithms, as well. UnMICST produces a pixel probability map that gives each pixel of the image a probability of being part of a cell or not. S3segmenter takes the probability maps and uses them to generate single-cell masks. We need these for the next step!
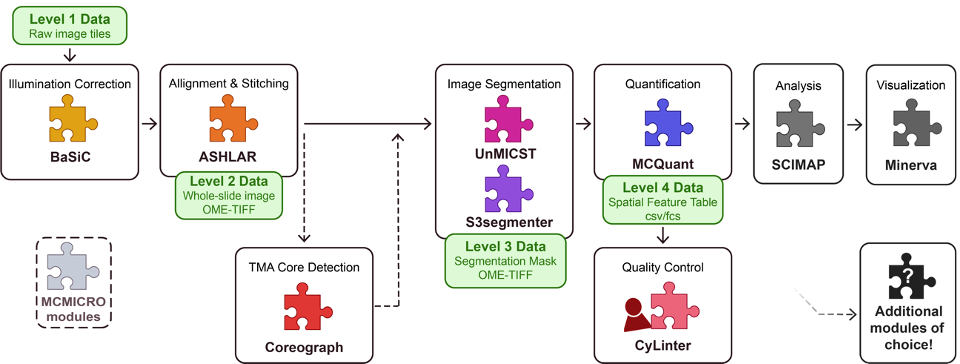
The segmentation masks and the images are then processed for
quantification of each channel by software called MCQuant. MCQuant
is going to extract single-cell data about the intensity of the fluorescent
probes – and thus, a measure of the expression of each probe’s target in each
single cell. It outputs a Feature Table – a big, comma-separated values table
with one row for each cell and that cell’s measurements for each channel, plus
that cell’s spatial position. This gives us a spatial output of gene or protein
or other molecule presence.
From here, MCMICRO can have a quality control step called CyLinter. CyLinter
is a human-in-the-loop (aka manual) software for removing cells that are
corrupted by microscopy artifacts. Because it is an interactive software,
CyLinter is NOT part of the CGC pipeline. There is a chance later to
visually inspect the slides, and humans are really very good at picking out whether
there are artifacts. If you end up using this for your own data, rather than
just with the example data we provide, you may wish to inspect your slides and
determine if you want to try to run CyLinter on your own machine,
downloading the data from the pipeline thus far.
Lastly, Scimap will do some clustering of cell types based on the quantification data, and then Minerva will be run to create an interactive visualization of the data – giving you back the images, but now with cells outlined and making it possible for you to turn on and off different channels for visual inspection.
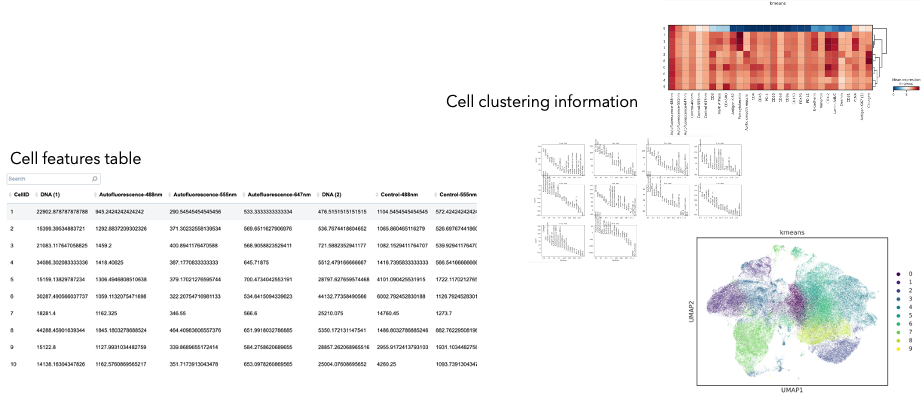
Once your analysis is complete several output files are generated.
Semantic segmentation in MCMICRO produces 32-bit masks, which are used to quantify pixel intensity (that is, protein expression) on multiplexed whole slide images for cytoplasm and nuclei. The resulting spatial feature tables are exported as comma-separated value (CSV) files for subsequent data analysis.
In addition to these tables, publication-ready plots are generated. Pictured above the text are heatmaps and UMAP plots for cluster visualization.
For a visual guide to the workflow, check out:
mcmicro.org/overview/pipeline-visual-guide.html
3. Step-by-Step Guide to
Running the MCMICRO Pipeline on CGC
In this step-by-step guide, you will perform an image-based
microscopy image processing analysis from start (raw multiplexed images) to
finish (segmented images and extracted single-cell features). The files, apps,
and workflow are pre-loaded as part of a public project hosted on the Cancer
Genomics Cloud (CGC) titled "MCMICRO - End to End Microscopy Image
Processing Public Project" (login required).
MCMICRO is an end-to-end processing pipeline for multiplexed whole slide imaging and tissue microarrays. It comprises stitching and registration, segmentation, and single-cell feature extraction. This implementation is a CWL wrapper designed by Seven Bridges to cover the default features of the original Nextflow app developed by the analysis authors. The original Nextflow app is available on GitHub or via the project's homepage.
This tutorial is intended for users with little to no experience with the Cancer Genomics Cloud or cloud-based computing, and who may or may not have experience with performing multiplexed imaging analysis. If you already feel comfortable with performing analyses on the CGC, a succinct overview of the below procedure is available on the CGC Knowledge Center.
You must have an account on the CGC, and compute credits attached to that account. Pilot funds are available through the NCI; contact Support to request them. Cost and run-times vary, but a few examples are provided in the Performance Benchmarking image below:

Getting Started with the Public Project
On the CGC and other Seven Bridges platforms, work is organized as projects, which contain files, apps, and tasks.
Here, we will start with a fully formed project and walk through each part. You will learn how to copy a public project, explore the files and apps available within it, run the associated analysis, and see the results.
Find and Copy the Public Project
· From your user dashboard, click on the Public Projects dropdown menu and find the public project titled "MCMICRO - End to End Microscopy Image Processing Public Project." Click the project name.
· Find the information tooltip next to the project title at the top of the page. Click the tooltip and find the green Copy Project button.
· Copy the project to your workspace.

Explore the Preloaded Files
From the project dashboard, click the Files tab at the top of the page.

Each folder contains a channel marker file, as well as .ome.tiff
raw image files.
Learn more here: https://docs.cancergenomicscloud.org/docs/mcmicro
Explore the Image Processing Workflow
Click on Apps in the project header to view the software tools associated with the project. This project demonstrates the usage of two CWL versions of MCMICRO, namely MCMICRO and MCMICRO for HTAN, on four different samples.
- MCMICRO: A full version of the workflow, including illumination correction, background subtraction, registration, segmentation, and feature extraction.
- MCMICRO for HTAN: A streamlined version optimized for HTAN data, which skips illumination correction, background subtraction, and registration as HTAN data is already pre-registered.
Note: HTAN data is available on the CGC through the
Cancer Data Service Explorer.
For access to CWL apps used in these workflows, contact the CGC support team.
Run the Workflow Yourself
To see how all these components work together, we will run the workflow from start to finish.
Step 1: Prepare Input Files
· Raw Image Files: Ensure you have the raw image files in OME TIFF format. These files contain the multiplex tissue images captured during the experiment.
· Channel Markers File: Prepare a CSV file with the following columns:
· Channel Number
· Cycle Number
· Marker Name
· Excitation Wavelength
· Emission Wavelength
Note: Both files can be found within folders under the “files” tab of your project.
Step 2: Set Up the Pipeline
· Access the MCMICRO App: Navigate to the “Apps” section within your CGC project.
· Input Files: Upload the raw image files and the channel markers file.
· App Settings: Configure the following settings:
· Maximum Shift for Registration: Set to 15.
· Run Background Subtraction: Set to false.
· Run D-Array for TMA: Set to true if using a tissue microarray.
· Segmentation Algorithms: Enable Cellpose, Elastic, Mesmer, and UNMIST.
· Custom Base Name: Provide a custom base name for the output files.
Step 3: Run the Pipeline
· Start the Task: Click the "Run" button to start the pipeline.
· Monitor Progress: Use the "View Stats and Logs" feature to monitor the progress and check for any errors. You can view real-time metrics and logs to ensure the task is running smoothly.
Step 4: Analyze and Visualize Results
· Quantification Data: Review the quantification data for each cell, including the intensity of fluorescent probes. This data is available in CSV format and can be used for further analysis.
· Clustering Results: Analyze the clustering results using various algorithms like K-means, Leiden, and Phenograph. The results are available in H5AD format and can be visualized using tools like UMAP.
· Visualization: Use Minerva to visualize the results and explore the spatial distribution of cell types. The interactive visualization allows you to turn on and off different channels for detailed inspection.
Conclusion
This workshop provided an overview of digital pathology and spatial genomics, introduced the MCMICRO pipeline, and guided you through running the pipeline on the CGC. By following these steps, you can analyze and visualize multiplex tissue images to gain insights into gene and protein expression at the single-cell level. Schapiro, D., Sokolov, A., Yapp, C. et al. MCMICRO: a scalable, modular image-processing pipeline for multiplexed tissue imaging. Nat Methods 19, 311–315 (2022). https://doi.org/10.1038/s41592-021-01308-y
Homework:
· Setup an MCMICRO run from scratch and view the outputs.
o Use the Exemplar_001 Data.
The steps you need to follow are these:
Create the Task from the "Apps" page on the CGC
1. Select the correct channel marker file
2. Select the correct ome.tiff images as input
3. Set the ASHLAR maximum shift option to 30
4. Set MCMICRO Background subtraction to FALSE
5. Set Is TMA to FALSE
6. Under MCMICRO Segmentation:
• Make sure "Run Cypository Segmentation" is set to False
• Set "Skip recyze" to True
• Run the other segmentation algorithms at your discretion. You must select at least one of them, and you may select all of them.
7. Under "Determine basename" be sure to set the "Custom basename" to some string that will identify these outputs. No spaces allowed.
• This task should take less than 1 hour to run. If you experience errors, you may write to support@velsera.com to get help troubleshooting.
MCMICRO is a multi-institutional effort with contributions by
the following developers:
|
Institution |
People |
|
Harvard Medical School |
Artem Sokolov |
|
Clarence Yapp |
|
|
Jeremy Muhlich |
|
|
Yu-An Chen |
|
|
Clemens Hug |
|
|
Greg Baker |
|
|
Juha Ruokonen |
|
|
Edward Novikov |
|
|
Robert Krueger |
|
|
Heidelberg University |
Denis Schapiro |
|
Florian Wünnemann |
|
|
Miguel Ibarra |
|
|
Krešimir Beštak |
|
|
Victor Perez |
|
|
Oregon Health and Sciences University |
Allison Creason |
|
Jeremy Goecks |
|
|
Daniel Persson |
|
|
Qiang Gu |
|
|
Luke Sargent |
|
|
Cameron Watson |
|
|
Luke Strgar |
|
|
Dana-Farber Cancer Institute |
Ajit Johnson |
|
Vanderbilt University |
Darren Tyson |
|
Brigham and Women’s Hospital |
Giorgio Gaglia |
|
The Jackson Laboratory |
Brian White |
|
Broad Institute |
Huan Wang |
|
Brigham Young University |
Matthew Hodgman |
|
Indica Labs |
Erik Burlingame |
|
University of Macau |
Yimin Zheng |
|
Sage Bionetworks |
Adam Taylor |
To Cite:
Schapiro, D., Sokolov, A., Yapp, C. et al. MCMICRO: a scalable, modular image-processing pipeline for multiplexed tissue imaging. Nat Methods 19, 311–315 (2022). https://doi.org/10.1038/s41592-021-01308-y